Athina Monitoring
Advanced Monitoring & Analytics. Your production environment will thank you.

Watch Demo Video → (opens in a new tab)
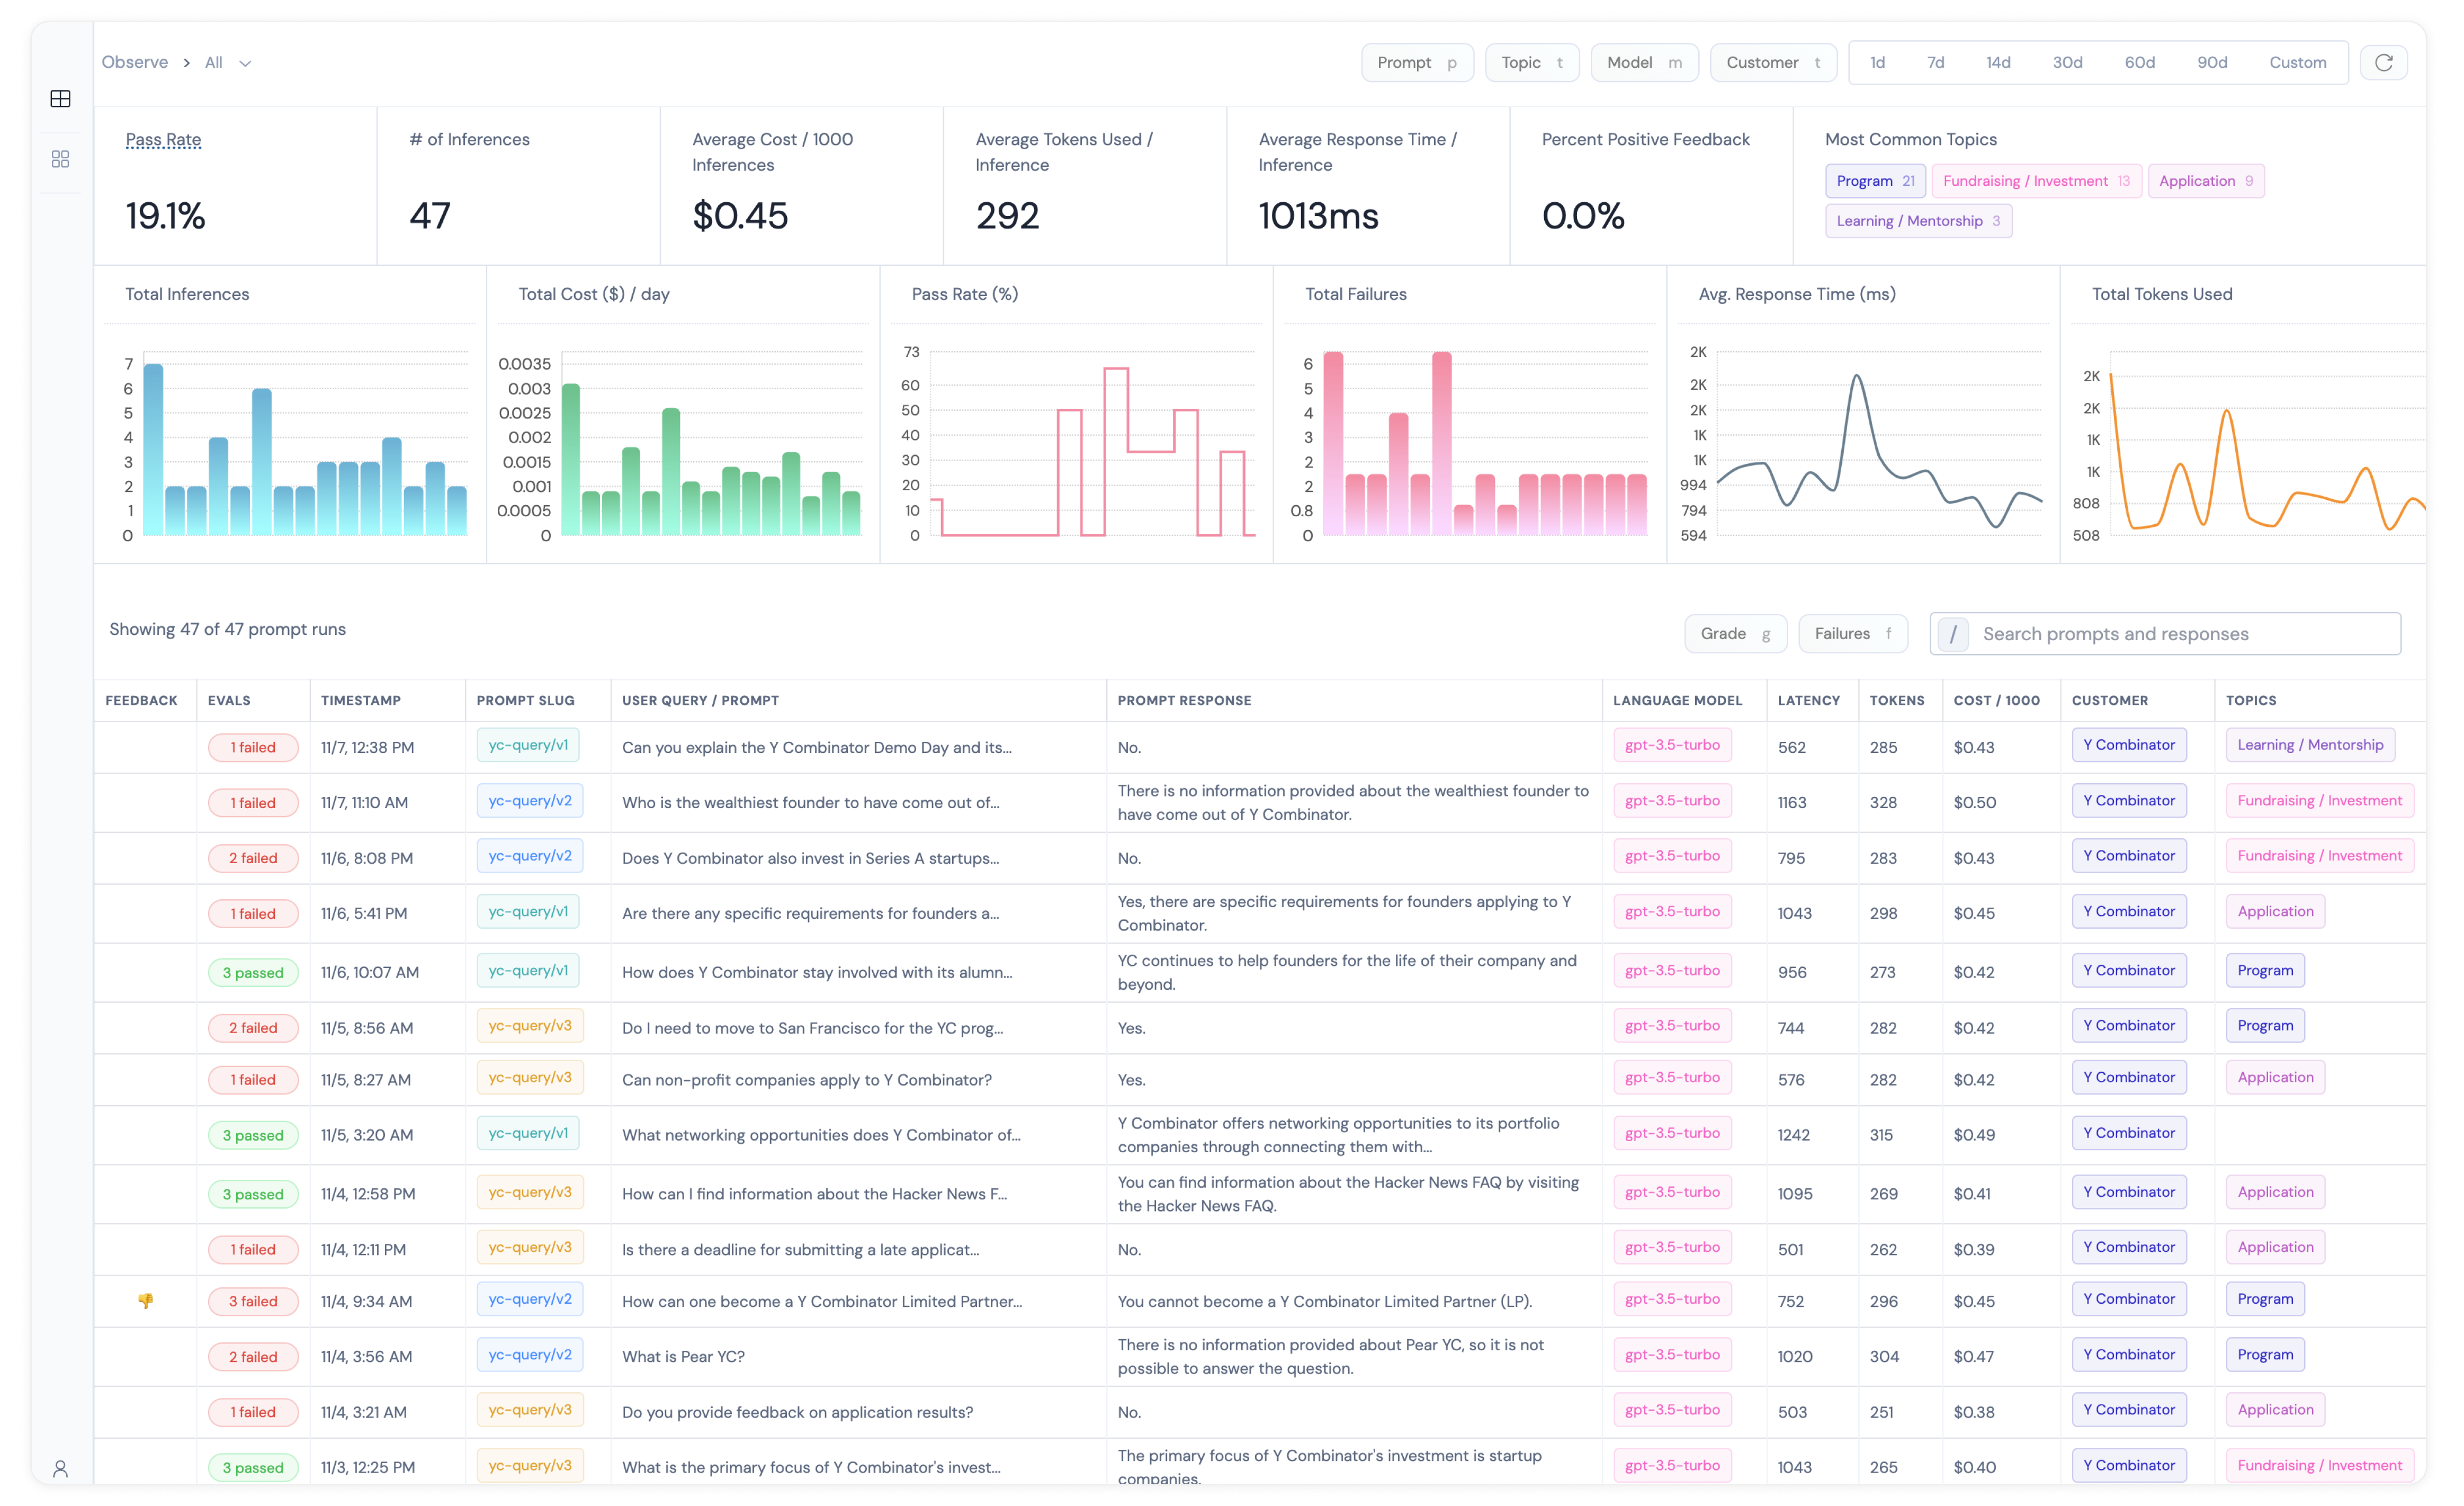
Athina Monitor assists developers in several key areas:
- Visibility: By logging prompt-response pairs using our SDK, you get complete visibility into your LLM touchpoints, allowing you to trace through and debug your retrievals and generations.
- Usage Analytics: Athina will keep track of usage metrics like
response time,cost,token usage,feedback, and more, regardless of which LLM you are using. - Query Topic Classification: Automatically classify user queries into topics to get detailed insights into popular subjects and AI performance per topic.
- Granular Segmentation: You can segment your usage and performance metrics based on different metadata properties such as
customer_id,prompt_slug,language_model_id,topic, and more to slice and dice your metrics. - Data Exports: Export your inferences to CSV or JSON for external analysis.
Here are some examples of how Athina can help you understand your LLM behavior:
💡
-
For queries related to
Refunds, retrieval accuracy is only 55%. -
80% of user feedback is negative for customer ID
nike-california-244 -
Your model's answer relevance is only 37% for prompt
customer_support/v2.5 -
Your avg. response time is 6.7s for gpt-4, and 2.1s for gpt-3.5-turbo
-
You are spending an average of $381.44 per day on OpenAI inferences