Athina Develop: A Dashboard for your Iterations
Athina Develop (opens in a new tab) is a dashboard for developers to view their evaluation results and metrics, and track all past experiments.
While you can run evals and view results from your command line / python notebook, Athina Develop provides a more user-friendly interface for developers to view their results and metrics.
Athina Develop will also keep a historical record of every iteration of your model, so you can track your progress, compare results, and revisit old prompts / settings.
How to log to Athina Develop
Simply set your AthinaApiKey, and eval results will be logged to Athina Develop automatically.
from athina.keys import AthinaApiKey

AthinaApiKey.set_key(os.getenv('ATHINA_API_KEY'))
History of Eval Runs

Athina Develop is located at https://app.athina.ai/develop (opens in a new tab)
Open this page and login with your Athina account.
This page will show you a history of all your prior eval runs. You can filter by model, dataset, experiment name, and prompt.
Click on any row to view the results for that run.
Eval Results

Your URL will look something like this: https://app.athina.ai/develop/request/09dc1234-abcd-5678-wxyz730f1a2b
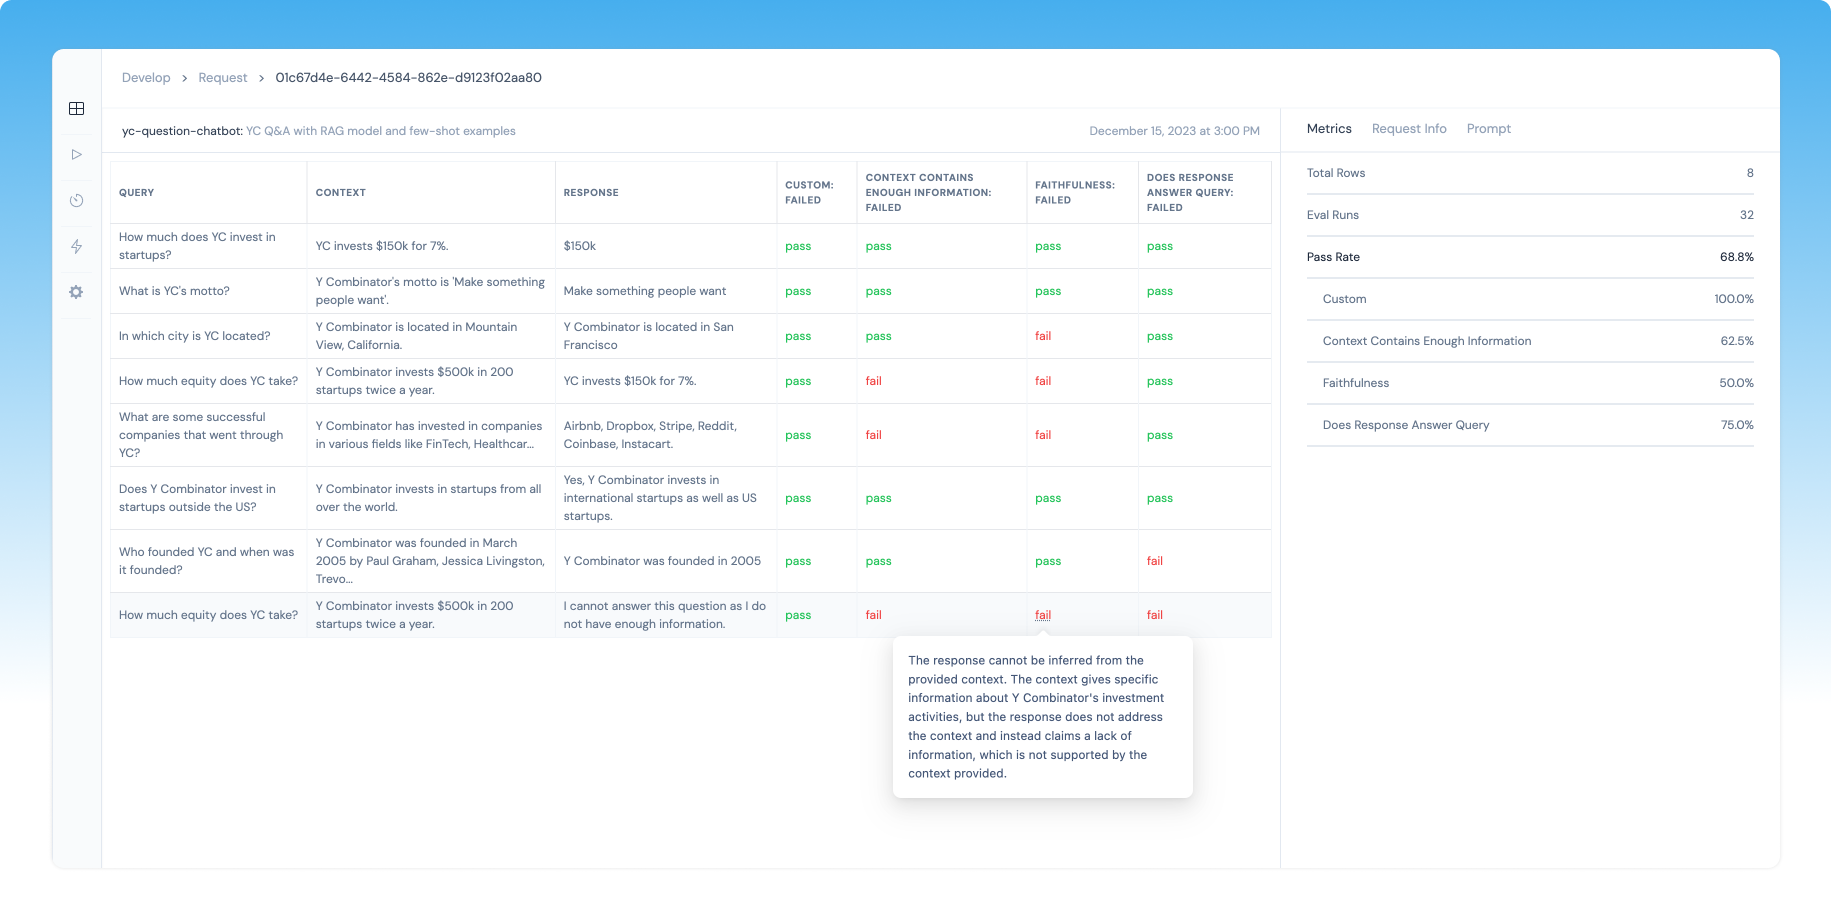
When you open an eval run, you will see a table with all the datapoints from your dataset.
For each eval that you ran, there will be a column with its results and metrics.
For example, in this screenshot below, there were 4 evals that ran on 8 datapoints.
If you hover on the pass or fail for any datapoint, you will see the reason for that eval result.
Click on any datapoint to view the full eval results for that datapoint
Eval Metrics
On the right hand side, you will see the aggregate metrics for this eval run.
This will include a metric called pass rate, which specifies the percentage of evals that passed.
There will also be a breakdown of the pass rate per eval type that ran.
Experiment Parameters
If you click on the Request Info tab, you can see the experiment parameters that were used for this eval run.
If you click on the Prompt tab, you can see the prompt specified in your experiment metadata.